Michelle Williams has authored a study (carried out at Sandia National Laboratories and funded by Laboratory Directed Research and Development) for the U.S. Department of Energy, Office of Scientific and Technical Information, outlining recent findings about unique materials for digital fabrication in Geomechanical characterization of Geo-architectural Rock Specimens using Gypsum-based 3D printing.’
Because of the natural diversity in rock samples being studied by scientists, there are often challenges in classification. Williams’ study is meant to improve methods for the evaluation of characteristics in natural rock. As with so many other fields too, ranging from automotive to aerospace, medicine and dental, construction, and nearly every industry one can think of, 3D printing offers improvements on previous methods, designs, prototypes and parts, and more.
In relation to rocks, 3D printed models can help scientists have a better understanding of the following:
- Strength
- Density
- Porosity
- Microstructure
- Mineralogy
- Geophysical
- Mineralogical interactions
Conventional methods for study include microscopy, CT scans, micro-CT scans, and many other techniques, to include rock mass classification; however, issues such as fractures, bedding, inclusions, joints, and more, present challenges during examination. Many benefits arise with the use of 3D printing, from ease in production of models as well as speed, affordability, and the potential for fabrication of complex geometries.
Understanding Filament Properties
The scientists printed 36 samples in cylinder form, using a powder-based Gypsum 3D ProJet360 printer with an HP11 printhead and VisiJet PXL Clear binder as the material.
Material Comparison and Selection
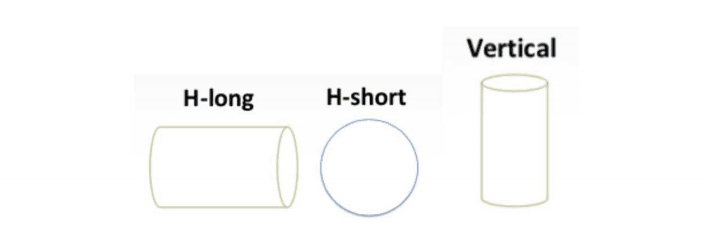
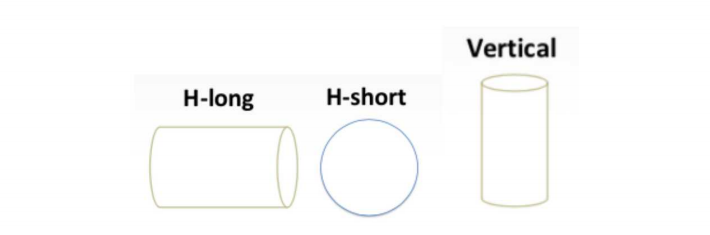
Printing direction with respect to horizontal tray. Adapted from SAND2019-14916C.
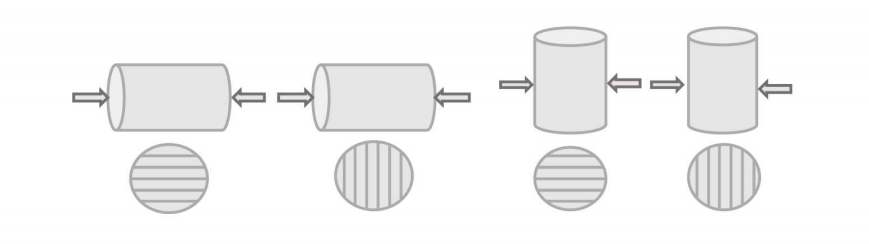
Direction and location of velocity measurements
The researchers noted velocity and took pictures of each sample before evaluation; they were then baked in a humidity chamber and tested on an MTS 22kip frame.
Print Settings and Optimization
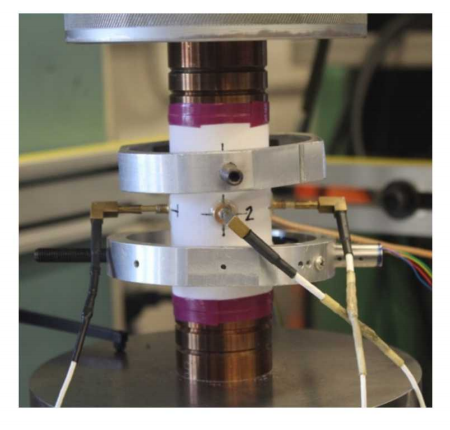
3D printed sample stack with LVDTs

MTS 22kip load frame used for UCS testing at Sandia National Lab
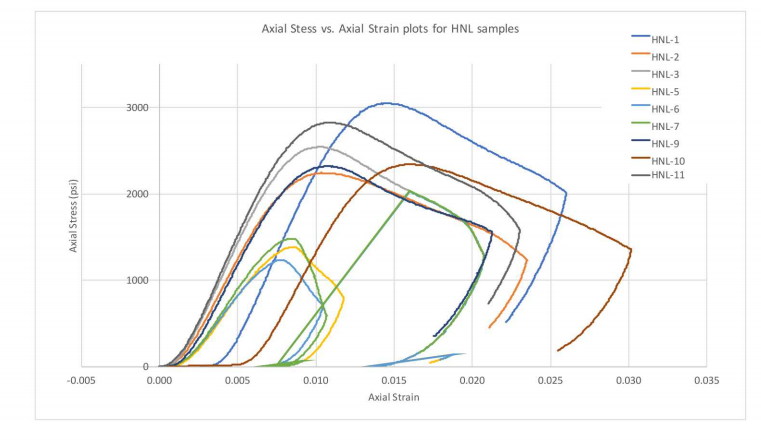
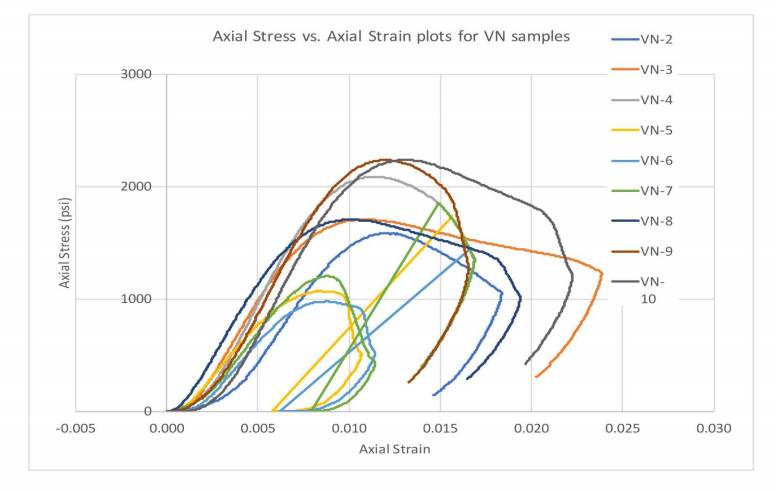
Stress versus strain curves reflected the greatest strength in samples printed in the H-long direction, with the vertically printed samples coming in second. H-short samples were the weakest.
Strength and Durability Testing
H-long samples-strongest, stress vs. strain plots

H-short samples-weakest, stress vs. strain plots
Cost and Availability Considerations
Vertical samples-middle strength, stress vs. strain plots
“With varying amount of binder, the larger amount (blue) resulted in the strongest rock during UCS testing,” stated Williams. See also: ABS 3D Printing Settings Guide: Temperature, Enclo…. “Density was also measured to ensure additional binder amount, and the higher density sample is the sample with the larger amount of binder.”
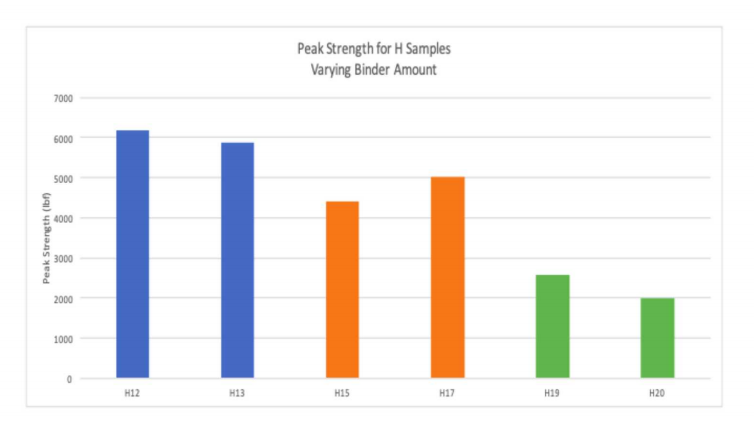
Peak strength vs. varying amount of binder
Advanced and Specialty Filaments
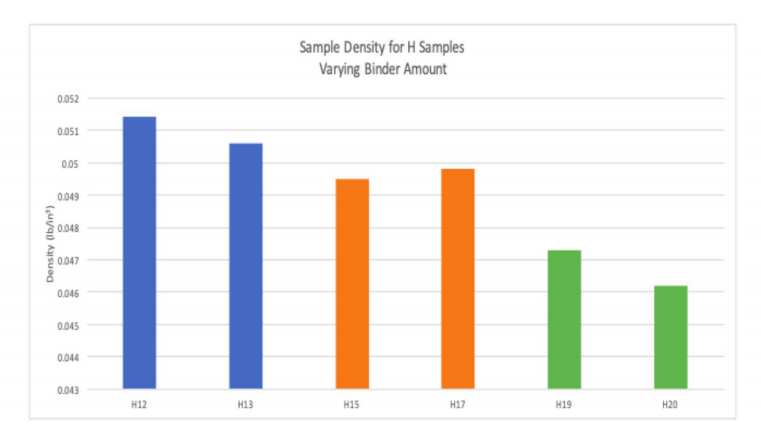
Density vs. varying binder amount
The environment was responsible for differences in strength. The team noted that baked samples were strongest, while weakest were left in humidity levels of 80 percent.
“Test results of the 3D printed geo-architected rock specimens demonstrated reasonable reproducibility and appear to be a promising path towards increasing the ability to characterize natural rock,” concluded Williams.
Understanding Filament Properties
“Future work could improve the Python code to also calculate and compare Young’s Modulus from the UCS data versus that from the velocity measurements. Due to the high impact of the 3D printing, advances in the technology appear inevitable. Such advances may help control sample microstructure, which will increase the value of this technology for understanding classification of rock characteristics.”
What do you think of this news? Let us know your thoughts! Join the discussion of this and other 3D printing topics at 3DPrintBoard.com.
[Source / Images: ‘Geomechanical characterization of Geo-architectural Rock Specimens using Gypsum-based 3D printing.’]
The post Gypsum-Based 3D Printing Assists in Classifying Geo-Architectural Rock Specimens appeared first on 3DPrint.com | The Voice of 3D Printing / Additive Manufacturing.
Frequently Asked Questions
What is the best 3D printing filament for beginners?
PLA is the best starting filament — it prints easily at 190-220°C without an enclosure and produces good results. Once comfortable, PETG offers better strength and temperature resistance for functional parts.
How do I choose the right filament?
Consider the application: PLA for display models, PETG for functional parts, ABS/ASA for heat/sunlight exposure, TPU for flexible parts, and specialty filaments for engineering applications. Each has specific printer requirements.
What temperature should I print different filaments at?
PLA: 190-220°C nozzle / 50-60°C bed. PETG: 220-250°C / 70-80°C. ABS: 230-260°C / 100-110°C (enclosure needed). Nylon: 240-270°C / 70-90°C. Always check manufacturer recommendations for specific brands.
📌 Related Articles
- The Current State of Metal 3D Printing in 2020
- ABS 3D Printing Settings Guide: Temperature, Enclosure, and Cooling for Strong Parts
- Best 3D Printer Upgrades That Actually Improve Print Quality: Complete 2026 Guide
- Best Budget 3D Printer Upgrades That Actually Improve Print Quality: Belts, Springs, Hotends & More
- 3D Printing News: Multi-Material Breakthrough and Aerospace Market Boom