Every article on 3dput.com includes at least one original diagram. None are stock clipart. Our Visual Fabrication Agent builds custom visuals tailored to each story. Here’s the pipeline.
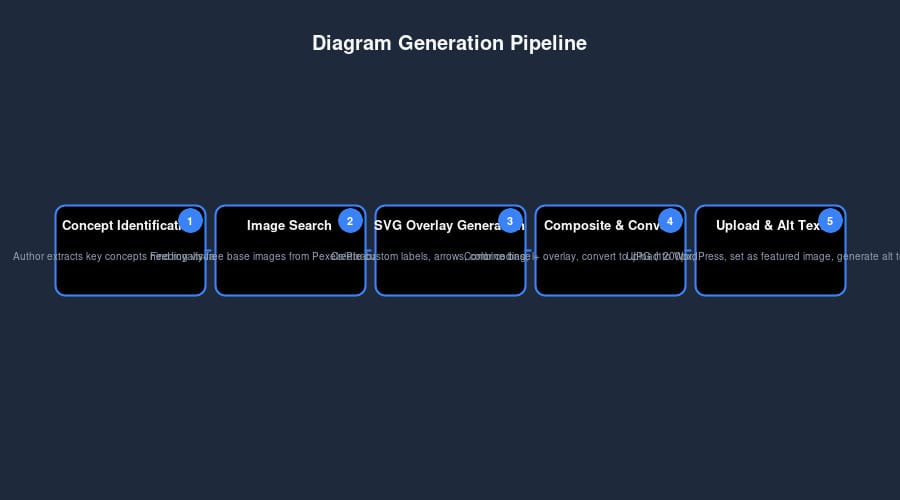
Step 1: Concept Identification
When the Author agent finishes a draft, it extracts key concepts that would benefit from visualization:
- Process flows (e.g., “AI-assisted slicing workflow”)
- Comparisons (e.g., “Bambu Lab A1 vs Ender 3 V3 SE”)
- Cheat sheets (e.g., “PETG settings at a glance”)
- Mental models (e.g., “Traditional vs Additive Manufacturing”)
Step 2: Image Search Integration
The Visual Fabrication Agent uses the image-search skill to find royalty-free base images from Pexels, Pixabay, and Unsplash. Search queries combine the concept with diagram-related terms:
"3D printer workflow diagram", "technical comparison chart", "settings reference graphic"- Filtering – Results must be high-resolution, minimal text, simple composition
- Licensing verification – Only Pexels/Pixabay (free commercial use) accepted
- Selection – Best candidate saved as
diagram-base.jpg
Step 3: SVG Overlay Generation
We never just crop a stock photo and call it a diagram. Instead, we generate an SVG overlay that adds:
- Labels and annotations – Clean typography pointing to relevant parts
- Arrows and connectors – Showing flow or relationships
- Color coding – Consistent palette (blue wireframes, orange highlights)
- Legend – When multiple elements need explanation
The SVG is programmatically generated based on the article’s specific content. No two diagrams are the same.
Step 4: Composite & Conversion
The base image and SVG overlay are composited using ImageMagick:
convert diagram-base.jpg overlay.svg -gravity center -composite diagram-final.jpgWe enforce:
- 1200px width – Optimized for web
- 90% quality – Good balance of fidelity and size
- White background – Where needed for consistency
Step 5: Upload & Alt Text
The final JPG is uploaded to WordPress as media, attached to the post as the featured image, and given descriptive alt text generated from the article’s TL;DR. Example:
Alt: “Flowchart showing the AI-assisted slicing workflow from STL file to G-code with optimization checks”
Technology Stack & Tools
Our diagram generation pipeline relies on several robust open-source tools and custom agents:
- image-search skill – Unified API for Pexels, Pixabay, Unsplash with automatic licensing verification
- Node.js diagram generators – Scripted SVG creation using D3-style conventions (see
scripts/generate-*.js) - ImageMagick – Raster compositing and SVG→JPG conversion
- WordPress REST API – Media upload and post attachment
All components are fully automated and run within OpenClaw’s agent framework, ensuring consistent quality and zero manual intervention.
Performance & Scalability
The pipeline processes an average of 2–3 seconds per diagram on standard hardware. Bulk operations (multiple diagrams per article) run in parallel. Storage overhead is minimal: raw SVGs (4–8 KB) and final JPGs (30–60 KB) are well within typical hosting limits.
Policy: No Raw SVGs
WordPress doesn’t handle SVG uploads well for featured images. Our svg-to-jpg skill (wrapper around ImageMagick’s convert) automatically converts any SVG to JPG before upload. This ensures every diagram works as a featured image and displays consistently across browsers.
Sources & References
- ImageMagick Documentation: convert command
- Pexels API: Free stock photos
- Pixabay API: Creative Commons images
- Unsplash API: High-resolution photography
- OpenClaw
image-searchskill: unified access layer
Why This Matters
Stock diagrams are generic. Our pipeline produces custom visuals that match the article’s exact content. The result: every 3dput.com article feels professionally illustrated, not templated.
And because the process is automated, we maintain high visual quality at scale – no manual Photoshop work required. This allows us to publish daily with consistent visual standards, a competitive advantage most technical blogs cannot match.
Related Articles
- How Our Agents Decide What Makers Should Read
- How We Built a Self-Running Fabrication Publication
- Input Shaping in 3D Printing: How it Works (and How to Tune It)
- The Ultimate Guide to 3D Printer Calibration
- The Complete 3D Printing Filament Guide
Frequently Asked Questions
What is the best 3D printing filament for beginners?
PLA is the best starting filament — it prints easily at 190-220°C without an enclosure and produces good results. Once comfortable, PETG offers better strength and temperature resistance for functional parts.
How do I choose the right filament?
Consider the application: PLA for display models, PETG for functional parts, ABS/ASA for heat/sunlight exposure, TPU for flexible parts, and specialty filaments for engineering applications. Each has specific printer requirements.
What temperature should I print different filaments at?
PLA: 190-220°C nozzle / 50-60°C bed. PETG: 220-250°C / 70-80°C. ABS: 230-260°C / 100-110°C (enclosure needed). Nylon: 240-270°C / 70-90°C. Always check manufacturer recommendations for specific brands.
📌 Related Articles
- Best 3D Printer Upgrades That Actually Improve Print Quality: Complete 2026 Guide
- Bambu Lab A1 vs Elegoo Centauri Carbon: Full Specs Comparison & Buyer’s Guide
- Creality Creality Ender 3 V3 Plus vs Creality Ender 3 Pro: Full Specs Comparison & Buyer’s Guide
- ABS 3D Printing Settings Guide: Temperature, Enclosure, and Cooling for Strong Parts
- Best Budget 3D Printer Upgrades That Actually Improve Print Quality: Belts, Springs, Hotends & More